Abstract
Sequential BCR-ABL1 mRNA level measurement by reverse transcription quantitative polymerase chain reaction (RT-qPCR) is embedded in management of chronic myeloid leukaemia (CML) patients.
United Kingdom National External Quality Assessment Service for Leucocyte Immunophenotyping (UK NEQAS LI) has been providing External Quality Assessment (EQA)/Proficiency Testing (PT) to 200 laboratories undertaking BCR-ABL1 RT-qPCR analysis since 2007.
The Chinese CML Alliance (CCA), established in 2011 for the purpose of the standardization of BCR-ABL1 measurement includes 58 laboratories to date. Peking University People's Hospital (PUPH), the Chinese regional reference centre, has acquired conversion factors (CFs) for reporting BCR-ABLIS through sample exchanges with the Adelaide IMVS reference laboratory. Other members acquired their laboratory specific CFs thorough sample exchange with PUPH, and their CFs were regularly revalidated through testing distributed samples by PUPH.
We reviewed performance of CCA laboratories in UK NEQAS LI's BCR-ABL1 Quantification program to evaluate if technical standardization initiatives and local result alignment to the International Scale (IS) (defined as BCR-ABLIS) increased accuracy and precision of BCR-ABL1 measurement by CCA labs.
Methods
This study was facilitated by Diaceutics and Novartis. 5 CCA laboratories were included in 3 EQA/PT send-outs provided by UK NEQAS LI. Six standard samples and one additional educational sample were tested by CCA laboratories, alongside up to 207 other international participants. Samples comprised two lyophilized cell line mixtures containing dilutions of BCR-ABL1 (e14a2) positive K562 cells in a background of BCR-ABL1 negative HL60 cells.
For each send-out, CCA laboratories were assessed against the IS robust mean BCR-ABLIS for each sample tested and their proximity to the robust mean log reduction between two standard trial samples tested, providing information on CCA laboratory IS alignment and assay linearity.
Result
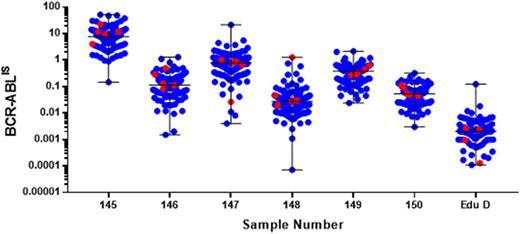
Median BCR-ABLIS sample levels in this study (calculated from all participant data) ranged from 6.1% to 0.002% (Figure 1). All five CCA laboratories used in-house based methods to measure BCR-ABL1; 3 based their in-house method on the Europe Against Cancer protocols. ABL1 was detected in all samples by the 5 centres with 4 achieving ABL1 levels >100,000. Additionally, 4/5 detected BCR-ABL1 transcript in all seven samples but 1/5 laboratories failed to detect any transcript in 1 sample (the sample that had the lowest level of transcript (median BCR-ABLIS = 0.002%; ~MR 4.7)).
4/5 laboratories measured BCR-ABL1IS levels within +2 SD of the robust means for individual sample and log reduction analysis undertaken between samples for each send-out.
Discussion
This study shows that efforts by the CCA to standardize BCR-ABL1 measurement and align local results to the IS have been successful. Satisfactory results (within +2SD of the robust mean) were obtained in 4/5 laboratories providing reassurance that patient testing in these laboratories is accurate and precise. A root cause analysis undertaken in the laboratory with results >+2SD from the robust mean found a pre-analytical sample transposition error that when reanalyzed was within the acceptable range for both individual sample and log reduction results.
The study showed that some CCA laboratories omitted the BCR-ABL1 standard curve, something not recommended in technical guidelines (Foroni et al., 2011) as erroneous results may occur due to unrecoqnized assay drift or suboptimal amplification. Standard curves for both ABL1 and BCR-ABL1 should always be run; however it is acceptable to run a standard curve each day for multiple runs but these must use the same master mix used for the sample quantification (Foroni et al., 2011).
Future studies will include more laboratories in the CCA network to assess if the use of internationally recognized calibrants can achieve even greater standardization.
Figure 1. All participant BCR-ABLIS results for the 7 samples tested. Blue markers = non CCA laboratories; red marker = CCA laboratories. Long horizontal black lines = IS median. Short horizontal black lines = range.
*Ya-Zhen Qin andStuart Scott contributed equally to this study.
No relevant conflicts of interest to declare.
Author notes
Asterisk with author names denotes non-ASH members.


